The BriefSpec Home dashboard is your command center — everything starts here. When you log in, you get an immediate pulse on your work. This guide walks through every numbered section in the screenshot below.
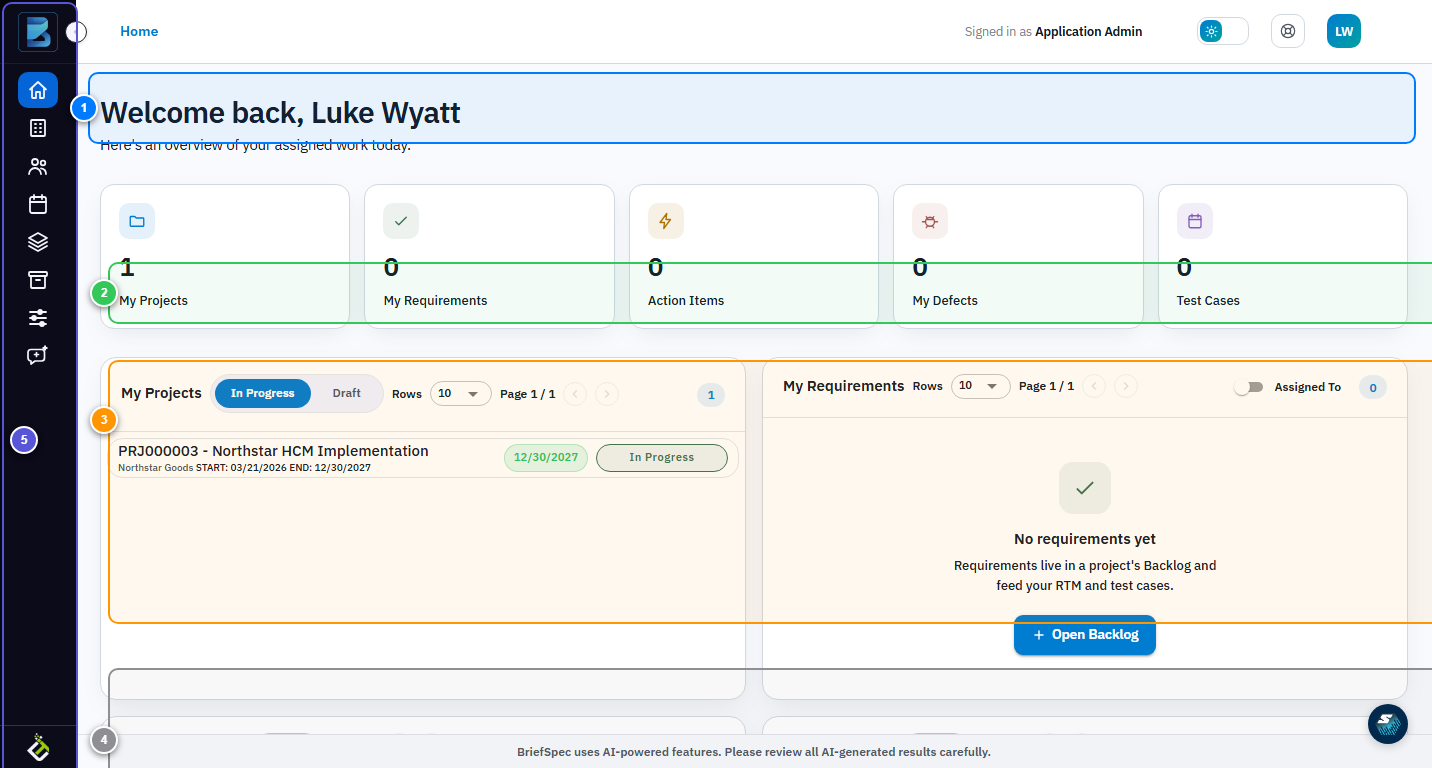
① Welcome Header
At the top, a personalized greeting with your name and a one-line summary of your assigned work. The breadcrumb above confirms where you are — click Home to return here from anywhere. The top bar also shows your role, a theme toggle, help, and your account menu.
② Metric Cards
Five cards give you instant visibility: My Projects, My Requirements, Action Items, My Defects, and Test Cases. Each card is clickable — select one to filter the tables below. Numbers update in real time so you always know what needs attention.
③ My Projects Table
Shows every project you’re involved with. Tabs let you switch between In Progress and Draft projects. Each row shows the project ID, name, client, timeline, and status. Click any project row to open its full workspace. Use the rows-per-page dropdown and pagination controls at the bottom to navigate larger lists.
④ Quick-Action Tables
Below the projects table, three dedicated sections — My Requirements, Action Items, and My Defects — each have their own table with Assigned To toggles and action buttons. These give you fast access to the work items that need your attention without navigating into individual projects. A New Test Case button at the very bottom lets you create a test case without leaving the dashboard.
⑤ Sidebar & Top Bar
The collapsible left sidebar navigates to every section of BriefSpec: Home, Projects, Clients, Users, Time Entry, Test Case Library, Settings, and Agent Spark. Hover over any icon to see its label, or click the expand arrow to pin it open. The top bar gives you breadcrumb navigation, your role context, a theme toggle, help, and your account menu.
Onboarding Checklist
New to BriefSpec? Look for the onboarding checklist at the top of your dashboard. It walks you through five steps in order — create your first project, add requirements, create a test case, run a test cycle, and invite your team — with each step linking directly to the right place.